Skip to content

Count gRPC alarm hook deliveries in the alarm delivery metrics and fix webhook hooks skipped next to other hook types - #14207

Merged
wu-sheng merged 1 commit into
apache:masterfrom
songzhendong:feat/alarm-grpc-delivery-so11y
Nov 11, 2026
Merged

wu-sheng merged 1 commit into
apache:masterfrom
songzhendong:feat/alarm-grpc-delivery-so11y

Conversation

@songzhendong

@songzhendong songzhendong commented Nov 8, 2026 •

Copy link
Copy Markdown
Contributor

Summary

Count gRPC alarm hook deliveries in the alarm delivery self-observability metrics that the HTTP hooks already use, and fix a webhook hook that was not posted when the alarm also named a hook of another type.

  • Metrics: each finished gRPC alarm or recovery stream records alarm_http_delivery_total{hook_type="gRPC", result} and alarm_http_delivery_latency_seconds{hook_type="gRPC"}. gRPC has no HTTP status, so it records no alarm_http_delivery_status_total. The metric names stay as released in 11.1.0, so the existing MAL rules, Grafana panels and Horizon widgets show the gRPC hook as one more channel.
  • result: a failed stream maps its gRPC status to the existing values, following the HTTP mapping in google/rpc/code.proto: DEADLINE_EXCEEDED → timeout, UNAVAILABLE → io_error, UNAUTHENTICATED / PERMISSION_DENIED → auth_failed, RESOURCE_EXHAUSTED → rate_limited, UNKNOWN / INTERNAL / DATA_LOSS / UNIMPLEMENTED → server_error, and any other code, including a CANCELLED sent by the peer → rejected. An interrupted wait cancels the stream and records interrupted. A hook without a live client sends nothing and records nothing.
  • Config: alarm.default.grpcTimeout / SW_ALARM_GRPC_TIMEOUT sets each gRPC stream's deadline (default 10 seconds, which was the fixed deadline before).
  • Fix: WebhookCallback looked up every hook name of the alarm in the webhook settings and read the URLs without a null check, so a non-webhook name threw a NullPointerException. With webhook.default and gRPC.default, the gRPC name comes first and the webhook was never posted.
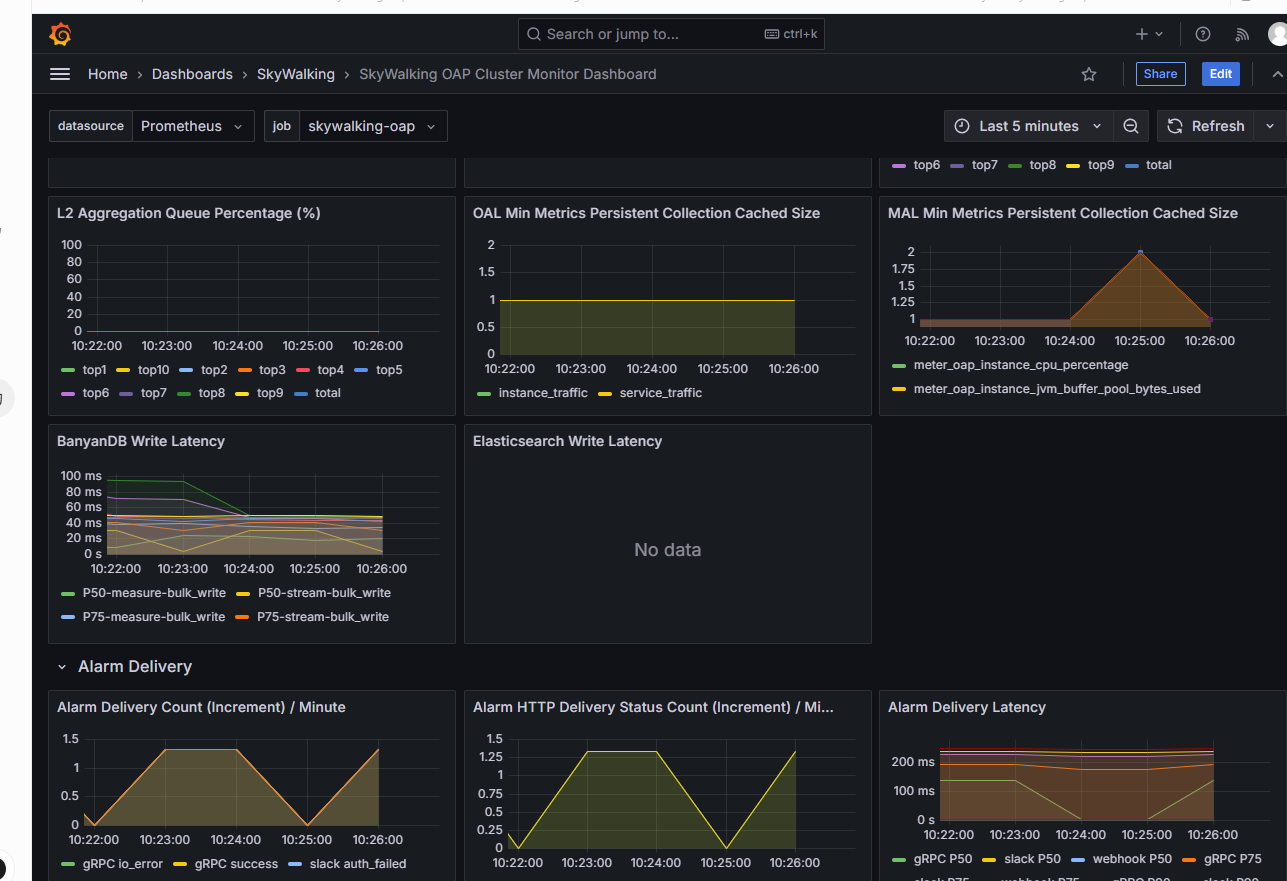
  • Grafana (grafana-instance.json, grafana-cluster.json): the "Alarm HTTP Delivery" row and its count and latency panels are retitled "Alarm Delivery".
  • Docs: backend-alarm.md, dashboards-so11y.md, changes.md.

Horizon UI: apache/skywalking-horizon-ui#217 (widget tips, the Responses widget's gate, docs). Screenshots of the Grafana and Horizon panels with the gRPC channel are in the comments.

Tests

  • Unit tests: gRPC status classification; success, timeout and interrupted against a local gRPC server; io_error against a refused loopback port; nothing recorded for missing or cleared gRPC settings; grpcTimeout defaulting, capping and propagation; webhook delivery alongside gRPC hook names.

  • E2E: the so11y and alarm cases deliver to AlarmGrpcHookServer (provider:9898) and check the hook_type="gRPC" series, including io_error for the refused gRPC.down hook.

  • Update the documentation to include this new feature.

  • Tests (including UT, IT, E2E) are added to verify the new feature.

  • Update the CHANGES log.

@wu-sheng

wu-sheng commented Nov 8, 2026

Copy link
Copy Markdown
Member

Please list the screenshots of your UI side changes about your newly added metrics.

@songzhendong

Copy link
Copy Markdown
Contributor Author

screenshots UI apache/skywalking-horizon-ui#217

@wu-sheng

wu-sheng commented Nov 8, 2026

Copy link
Copy Markdown
Member

Grafana thing has nothing related with Horizon UI.

@wu-sheng wu-sheng added backend OAP backend related. enhancement Enhancement on performance or codes labels Nov 8, 2026
@wu-sheng wu-sheng added this to the 11.2.0 milestone Nov 8, 2026
@songzhendong

Copy link
Copy Markdown
Contributor Author

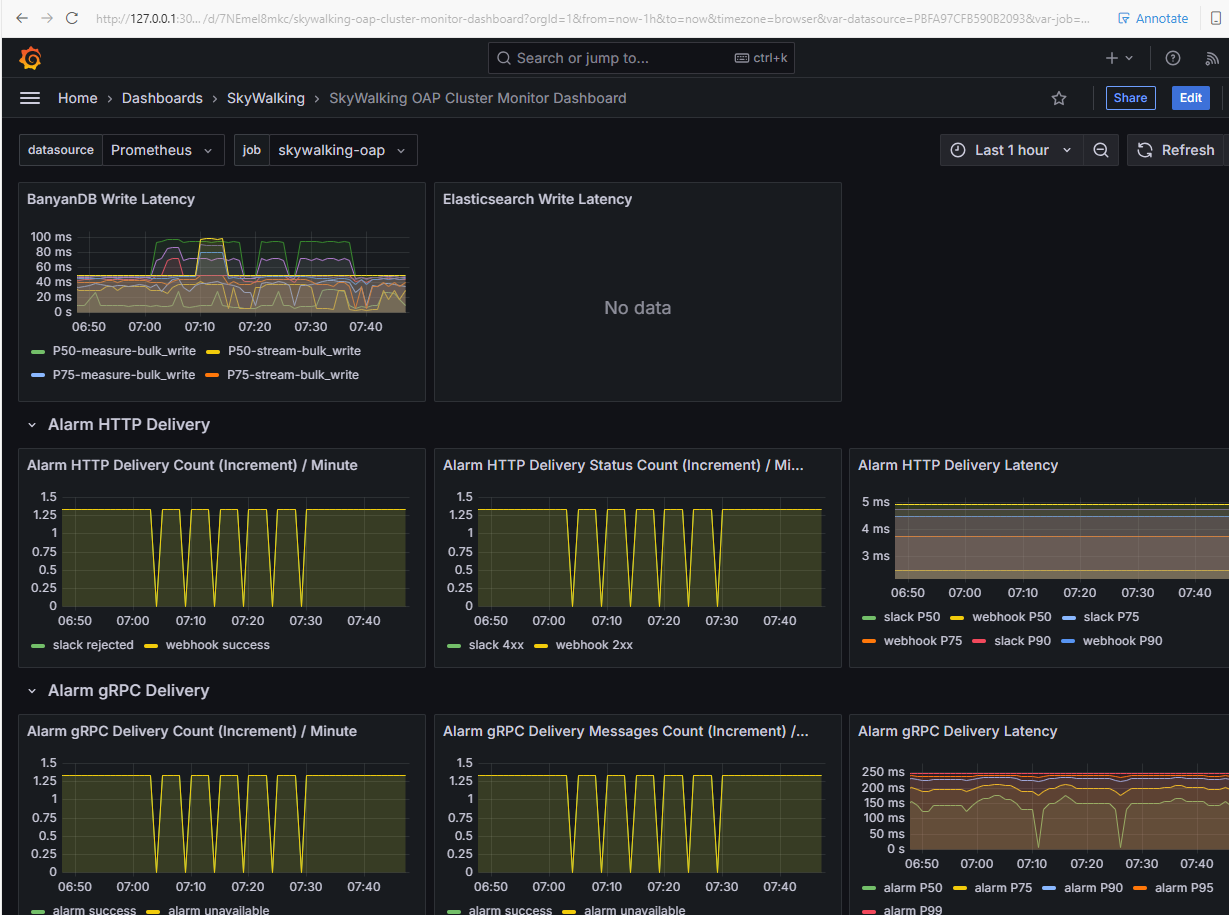
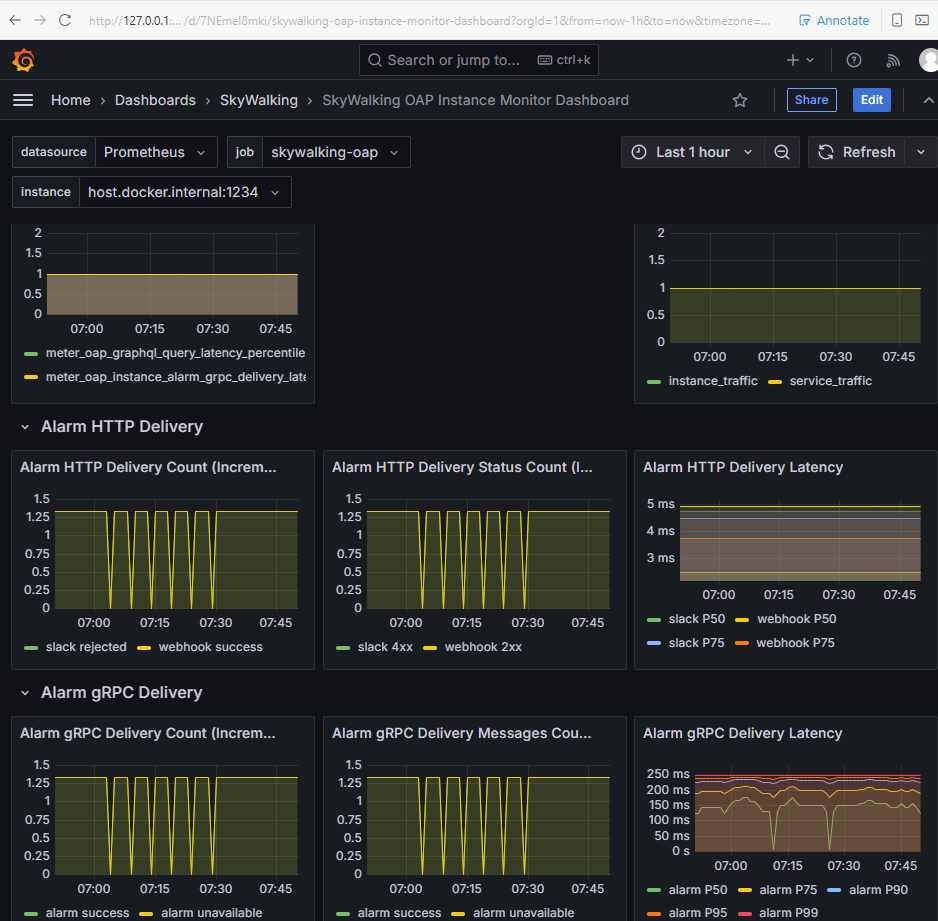
Local Grafana screenshots (OAP dashboards)

Alarm gRPC Delivery panels from a local Prometheus scrape of this branch's Grafana JSON.

OAP Cluster

Grafana OAP Cluster — Alarm gRPC Delivery

OAP Instance

Grafana OAP Instance — Alarm gRPC Delivery

@wu-sheng

wu-sheng commented Nov 9, 2026

Copy link
Copy Markdown
Member

Thanks for this. One design change before the line-by-line review: please record gRPC into the existing alarm delivery metrics instead of a separate metric family. Most deployments use one alarm channel, either the HTTP hooks or the gRPC hook, and few use both. The HTTP widgets are already split by channel (hook_type), so gRPC should be one more hook_type value in the same panels, not a second row of panels.

  1. GRPCCallback records through AlarmHttpDeliveryMetrics with hook_type="gRPC" (AlarmHooksType.gRPC.name(), the same way each HTTP hook passes its own type), and with statusClass = null: gRPC has no HTTP status, so it adds no alarm_http_delivery_status_total series. Remove AlarmGrpcDeliveryMetrics, the three new MAL rules and the new Grafana rows. Keep the metric names: they shipped in 11.1.0, and renaming them would break existing dashboards and alerts.

  2. Map the gRPC status to the existing result values. Follow the HTTP mapping documented in google/rpc/code.proto through AlarmHttpDeliveryMetrics.resultOfStatus, except for the two transport failures, which take the result the HTTP hooks give them:

    • stream completed → success
    • DEADLINE_EXCEEDED → timeout
    • UNAVAILABLE (refused, reset) → io_error
    • OAP's own wait interrupted, stream cancelled → interrupted
    • UNAUTHENTICATED, PERMISSION_DENIED → auth_failed
    • RESOURCE_EXHAUSTED → rate_limited
    • UNKNOWN, INTERNAL, DATA_LOSS, UNIMPLEMENTED → server_error
    • any other code, including a CANCELLED sent by the peer → rejected

    This also fixes the current CANCELLED → interrupted mapping. When OAP cancels the stream itself, the interrupted flag is already set and wins, so that mapping only applies when the peer cancels.

  3. Drop the message_kind label and alarm_grpc_delivery_messages_total. The HTTP hooks split neither alarm vs. recovery nor message counts. If they are useful, please propose them for every channel in a separate PR.

  4. Don't record a delivery for a hook with no live client (recordSkippedDelivery). Nothing is sent, so it is not a delivery attempt, and its 0-second latency sample pulls the percentiles down. The HTTP hooks behave the same: a malformed URL throws in URI.create before post() records anything, and the gRPC client build failure is already logged as an error. With this, GRPCCallback no longer needs the isGrpcHook check.

  5. Grafana (grafana-instance.json, grafana-cluster.json): instead of a new row, retitle the "Alarm HTTP Delivery" row and its count and latency panels to "Alarm Delivery", since they now include gRPC. The status panel stays HTTP.

  6. Docs: extend the "HTTP delivery so11y metrics" section of backend-alarm.md to cover gRPC: hook_type="gRPC", no status-class series, and the mapping above. Update the three alarm rows in dashboards-so11y.md to match.

  7. changes.md: please write three entries, one sentence each:

    • The webhook fix. On master, WebhookCallback reads a hook's URLs before checking that the hook is a webhook. An alarm that names both webhook.default and gRPC.default (for example both is-default: true) reaches gRPC.default first, throws an NPE, and never posts to the webhook. This is a user-visible bug, so the entry should say when it happens.
    • The new alarm.default.grpcTimeout / SW_ALARM_GRPC_TIMEOUT setting (default 10 seconds; it was a fixed 10 seconds).
    • gRPC hook deliveries on the alarm delivery metrics as hook_type="gRPC".
  8. e2e: keep AlarmGrpcHookServer and gRPC.down, and assert alarm_http_delivery_total{hook_type="gRPC",result="success"} and, for gRPC.down, result="io_error".

Please keep the webhook null check, the configurable per-stream timeout, the stream cancel on interrupt, and the shared alarm/recovery stream code.

Nits:

  • MAX_GRPC_TIMEOUT_SECONDS only aliases MAX_HTTP_TIMEOUT_SECONDS.
  • Math.max(1L, deadlineSeconds) in GRPCCallback repeats the provider's <= 0 fallback.
  • The grpcTimeout comment in application.yml uses →. Please word it like the httpTimeout comment above it.
  • The malformed-target comment in onGRPCAlarmSettingUpdated was shortened, which is unrelated to this PR. Please restore it.

@songzhendong
songzhendong force-pushed the feat/alarm-grpc-delivery-so11y branch from d2fd20f to 07d6982 Compare November 9, 2026 00:33

@surlymochan surlymochan left a comment

Copy link
Copy Markdown

Choose a reason for hiding this comment

The reason will be displayed to describe this comment to others. Learn more.

I read the full diff of the current head and checked it against @wu-sheng's design comment from 2026-11-09 00:05 UTC. The rework looks complete on all eight points; two small leftovers below.

Verified as addressed:

  1. gRPC now records through the shared AlarmHttpDeliveryMetrics with hook_type="gRPC" (GRPCCallback.recordDelivery, AlarmHooksType.gRPC.name()), statusClass = null, so no alarm_http_delivery_status_total series is added. No separate AlarmGrpcDeliveryMetrics, no new MAL rules, no new Grafana rows. record(..., null, ...) is safe: on master, record's javadoc says statusClass is "null when no response was received" and the status counter is guarded by if (statusClass != null).
  2. Status mapping in AlarmHttpDeliveryMetrics.resultOf / classifyGrpcDeliveryResult matches the requested table exactly, including peer CANCELLED -> rejected and interrupt winning over a concurrent DEADLINE_EXCEEDED. The interrupt path is covered by shouldRecordInterruptedWhenCallerInterruptedDuringWait (stalling server + caller.interrupt(), asserts 1 interrupted delivery and the caller finishing without waiting for the peer); the deadline path by shouldRecordTimeoutWhenPeerExceedsDeadline.
  3. No message_kind label and no alarm_grpc_delivery_messages_total.
  4. No delivery is recorded when nothing is sent: shouldSkipMessageHookMissingFromSettings asserts 0 deliveries / 0 latency observations, and the new shouldIgnoreForeignHooksWithoutRecordingMetrics / shouldNotRecordWhenAllGrpcSettingsCleared tests pin the same for foreign hooks and cleared settings.
  5. Grafana: only the "Alarm HTTP Delivery" row and its count/latency panels are retitled to "Alarm Delivery" in both grafana-cluster.json and grafana-instance.json; the status panel is untouched.
  6. Docs: backend-alarm.md gains the gRPC timeout section and the hook_type=gRPC mapping paragraph; dashboards-so11y.md retitles the count/latency rows and keeps the status row HTTP-only.
  7. changes.md has the three one-sentence entries (webhook NPE with the trigger condition, the new grpcTimeout setting, gRPC on the shared metrics).
  8. e2e asserts alarm_http_delivery_total{hook_type="gRPC",result="success"} and, for gRPC.down, result="io_error". The webhook null check is kept (WebhookCallback skips a null setting before getUrls), with the new ignoresForeignHooksWithoutNpe regression test. The configurable deadline, cancel-on-interrupt, and shared alarm/recovery stream code are all kept.

Two nits left:

  • The -> nit was fixed in oap-server/server-starter/src/main/resources/application.yml ("<= 0 falls back to 10") but the same comment in oap-server/server-tools/data-generator/src/main/resources/application.yml still reads "<= 0 -> 10". Please make the two copies match.
  • oap-server/analyzer/meter-analyzer-scripts-test/.../oap.data.yaml only gains stray blank lines in this diff (two hunks, no content change). Please drop them so the file is untouched.

Note: this is a code-read review only — I did not run the OAP test suite locally. The RecordingDeliveryMetrics harness only counts hook_type=gRPC series, which is the right scoping for the new assertions.

@songzhendong

Copy link
Copy Markdown
Contributor Author

Thanks for the review.

Morning tip (already on this PR, 07d69821f951) covered the redesign:

  1. gRPC records through shared AlarmHttpDeliveryMetrics with hook_type="gRPC", statusClass=null — no separate gRPC metrics / MAL / Grafana rows.
  2. Status mapping matches the requested table (CANCELLED → rejected; interrupt wins over concurrent deadline).
  3. No message_kind label and no alarm_grpc_delivery_messages_total.
  4. No delivery recorded when nothing is sent / settings cleared.
  5. Grafana count/latency retitled to "Alarm Delivery"; status panel unchanged.
  6. Docs updated (backend-alarm.md, dashboards-so11y.md).
  7. changes.md has the three one-sentence entries.
  8. e2e asserts shared alarm_http_delivery_total{hook_type="gRPC",...}; webhook null-check / regression tests kept.

Latest tip (536c666c7553) also addresses your two nits:

  1. Aligned the grpcTimeout comment in data-generator/.../application.yml with server-starter (<= 0 falls back to 10).
  2. Dropped the whitespace-only noise in oap.data.yaml (restored the accidental wipe of expected:).

Fork CI: songzhendong#34

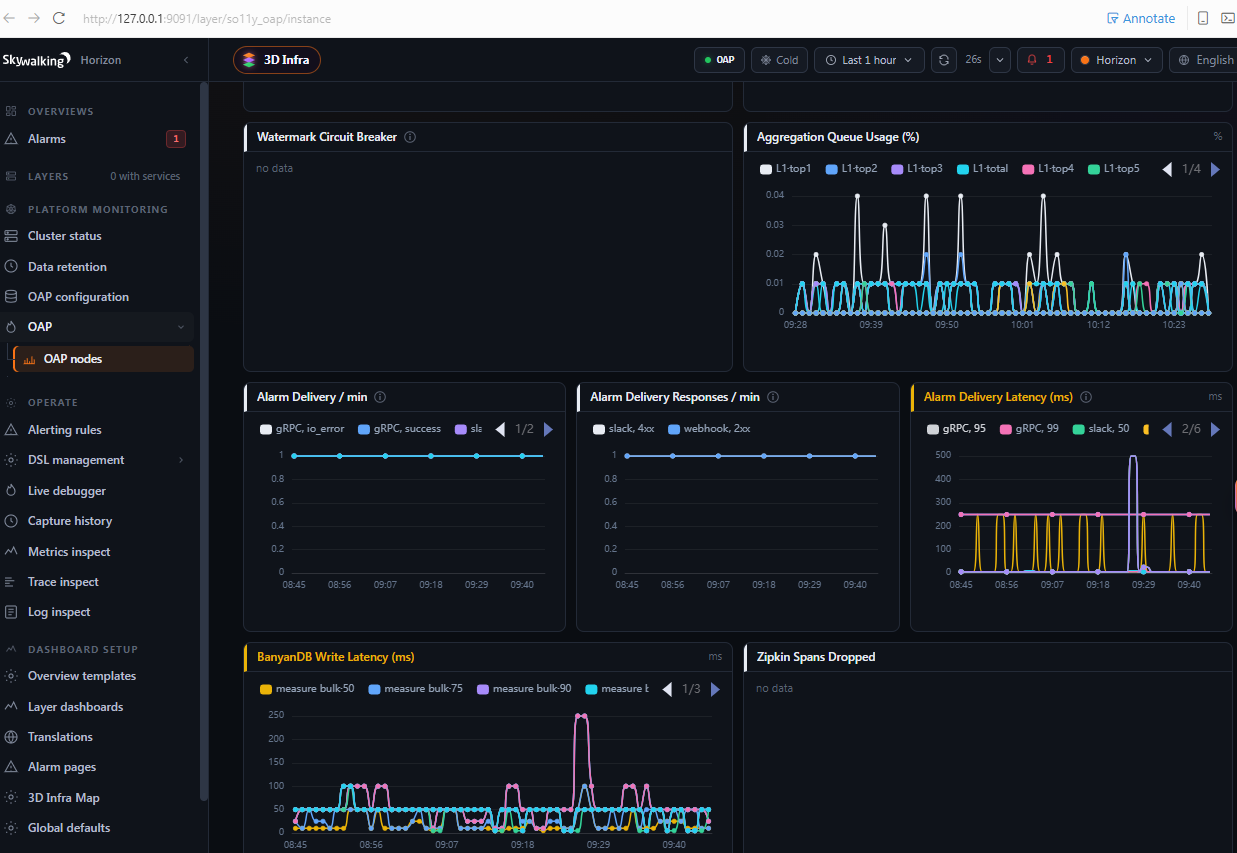
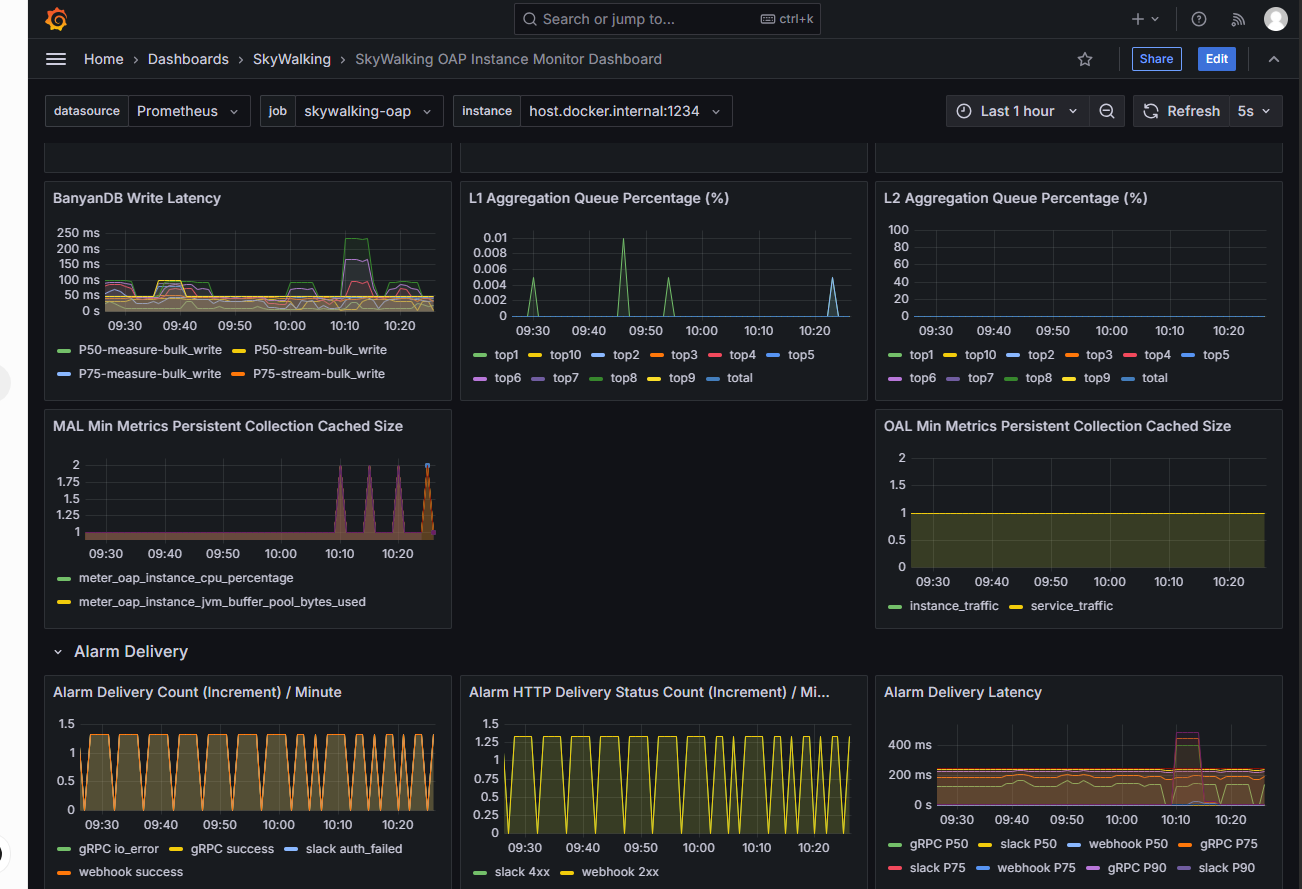
Live so11y screenshots (OAP tip + Horizon)

Same three positions as #14190: Horizon SO11Y_OAP Alarm Delivery row, Grafana OAP Instance, Grafana OAP Cluster.

Horizon SO11Y_OAP alarm delivery widgets

Grafana OAP Instance dashboard

Grafana OAP Cluster dashboard

@wu-sheng
wu-sheng force-pushed the feat/alarm-grpc-delivery-so11y branch from 536c666 to 53fbb7f Compare November 10, 2026 11:59
@wu-sheng wu-sheng changed the title Add gRPC alarm hook delivery so11y metrics on telemetry Prometheus Count gRPC alarm hook deliveries in the alarm delivery metrics and fix webhook hooks skipped next to other hook types Nov 10, 2026
@wu-sheng

Copy link
Copy Markdown
Member

Thanks for the quick rework. I rebased it onto master and squashed it into one commit with you as the author. If you have local work on this branch, save it before you git reset --hard to the new head. What I changed on top of your version:

  1. GRPChookCallbackTest: restored master's existing tests, including the initCallback / @AfterEach shutdownInitClients() cleanup, the port-0 server binding, their javadocs and the import order. Only their constructor calls change. I restored the shouldSkipMessageHookMissingFromSettings name and its original missing-hook fixture, retaining your no-record assertions. I removed interruptedWinsOverStreamTimeoutWhenClassifyingResult, which repeated classifyGrpcDeliveryResultPrefersInterrupt in AlarmHttpDeliveryMetricsTest.
  2. The new live-server tests bind port 0 too, and the four tests that build their own callback (success, refused target, interrupt, timeout) shut its clients down in finally, so a failed assertion no longer leaks them. The interrupt test interrupts and joins its caller thread before that cleanup.
  3. AlarmModuleProviderTest: moved your gRPC checks out of the existing deliveryMetricsAndHookTypesReachHttpHooks into a new test, deliveryMetricsAndDefaultTimeoutReachTheGrpcHook, so the existing test stays as it is on master.
  4. changes.md: resolved the conflict with master. Your three entries are at the end of the OAP Server section; the webhook entry now says what users saw, and the gRPC entry names the metrics.
  5. Renamed AlarmHttpDeliveryMetrics.resultOf(Throwable) to resultOfGrpcError, updated its callers and renamed the new mapping test to resultOfGrpcErrorMapsStatusCodes. The NotifyHandler#setDeliveryMetrics javadoc no longer says HTTP, and the HELP text of alarm_http_delivery_total and alarm_http_delivery_latency_seconds no longer says HTTP, since gRPC deliveries count there too.
  6. so11y-cases.yaml: the gRPC case no longer sleeps 60 seconds, since the gRPC hook delivers in the same alarm round as the webhook case before it. The so11y alarm-settings.yml keeps its original comment, extended to the gRPC hook.
  7. Both Grafana JSON files end as they do on master, without a trailing newline.
  8. Updated the commit message, PR title and description to the current change.

…x webhook hooks skipped next to other hook types

The gRPC alarm hook now records each finished alarm or recovery stream on
the alarm delivery self-observability metrics that the HTTP hooks use,
alarm_http_delivery_total and alarm_http_delivery_latency_seconds, with
hook_type=gRPC. It records no alarm_http_delivery_status_total series,
since gRPC has no HTTP status. The metric names stay as released in
11.1.0, so the existing MAL rules, Grafana panels and UI widgets show the
gRPC hook as one more channel. The Grafana "Alarm HTTP Delivery" row and
its count and latency panels are retitled "Alarm Delivery".

A failed stream maps its gRPC status to the existing results, following
the HTTP mapping in google/rpc/code.proto: DEADLINE_EXCEEDED is timeout,
UNAVAILABLE is io_error, UNAUTHENTICATED and PERMISSION_DENIED are
auth_failed, RESOURCE_EXHAUSTED is rate_limited, UNKNOWN, INTERNAL,
DATA_LOSS and UNIMPLEMENTED are server_error, and any other code,
including a CANCELLED sent by the peer, is rejected. When the alarm
thread is interrupted while waiting for the peer, OAP cancels the stream
and records interrupted. A hook without a live client sends nothing and
records nothing.

Each gRPC stream's deadline is now alarm.default.grpcTimeout
(SW_ALARM_GRPC_TIMEOUT), default 10 seconds, which was the fixed deadline
before.

Fix a webhook hook not being posted when the alarm also names a hook of
another type: WebhookCallback looked up every hook name of the alarm in
the webhook settings and read the URLs of the result without a null
check, so a non-webhook name threw a NullPointerException. With
webhook.default and gRPC.default, the gRPC name comes first and the
webhook was never posted.

The so11y and alarm e2e cases deliver to a gRPC hook server in the
provider service and check the hook_type=gRPC series, including io_error
for a hook whose target refuses the connection.
@wu-sheng
wu-sheng force-pushed the feat/alarm-grpc-delivery-so11y branch from 53fbb7f to 1405bad Compare November 10, 2026 12:38
@songzhendong

Copy link
Copy Markdown
Contributor Author

Thanks for the rebase, squash, and the follow-up cleanups. I'll reset my local branch to the new tip and keep an eye on CI.

@wu-sheng
wu-sheng merged commit b0a3065 into apache:master Nov 11, 2026
722 of 729 checks passed
Sign up for free to join this conversation on GitHub. Already have an account? Sign in to comment

Labels

backend OAP backend related. enhancement Enhancement on performance or codes

Projects

None yet

Development

Successfully merging this pull request may close these issues.

3 participants